The Story Behind Yian: A Minimalist Mood Tracker Inspired by ‘Year in Pixels'
How a Year in Pixels spreadsheet became Yian — a minimalist mood tracking journal that turns your days into insights with calendars and stats.
The Origin
Have you ever heard of the “Year in Pixels” calendar? It’s almost a tradition now to see these colorful grids popping up at the start of every new year on social media sites like Reddit. The first time I saw one of these calendars was on this post, in January 2022:
Posts from the mildlyinteresting
community on Reddit
Since it was the start of the new year, I figured it was the perfect time to try it myself — except I started mine on a Google Sheets instead of pencil/paper. By the end, it looked something like this:


While not as pretty or polished as the original Reddit post, I was still proud of it. And as a person who loves data, charts, and visual storytelling, I realized it was the perfect chance to collect and analyze data about my own life. Sure, rating how you feel each day is subjective — but even subjective data can reveal surprising patterns.
Here are some of the graphs I created from my first Year in Pixels experiment:


After a year of relentlessly filling in those Google Sheet cells, I finally had a full dataset — a snapshot of how my entire 2022 went. While it may not really mean too much to an outside observer, to me it was fascinating. I could actually see patterns — how my mood changed depending on the day of the week, the month, or even where I was.
For a bit of context behind the final graph, in December 2022 I visited family in Korea — the first time in over 6 years. It doesn’t take a genius to figure out that December ended up being the best month of my entire year.
As much as I loved looking at all these graphs, there was one caveat. Aggregating all this data into graphs by hand was extremely time-consuming. I want to especially highlight the Days of the Week graph which I had to count by hand (and double-check I didn’t make a mistake):


Fast-forward to the end of 2023 — another year, another completed “Year in Pixels” calendar. I was a little faster this time, but the process was still just as tedious as before.
Around then, a thought hit me: why not automate all of this?
As a Computer Engineering student, throughout the entire curriculum I had been learning how to code programs, with an emphasis on automating tasks that are boring, tedious, but most importantly, predictable. So I figured… why not use what I know to make my own life easier? That’s when the idea for an app started forming: something that could take the whole process — rating each day, storing the data, and generating the stats automatically — and turn it into something simple, quick, and actually enjoyable.
The Origin of the Name: “Yian”
One of the first things I thought of was what to call the app. While “Yian” might sound like a Chinese word at first, it is actually the abbreviation for “Year in a Nutshell.” I specifically chose “Nutshell” as a direct callback to the first Year in Pixel Calendar I filled out, which was called “2022 in a nut.” (nut being the shortened version of nutshell, because “nut” sounded funnier at the time..)

In case you don’t know, “in a nutshell” is a common phrase that means “in the fewest possible words”, a great representation of what a “Year in Pixels” calendar really is — a summary of an entire year in a brief/concise calendar.
However, I wanted the app to not just be a glorified “Year in Pixels” calendar app, but truly encapsulate the idea of summarizing and representing a whole year of someone’s life.
As a bonus, the concept made designing the logo easy (It is based on a walnut!). Here is an early rendition of the logo:

🔗 Learn more or download the app at yian.app
From Spreadsheet to App
With the name and logo locked-in, I moved on to the long process of building the app. Like I said previously, my goal was to not just be another “Year in Pixels” calendar app, plenty of which already exist on App Store and Google Play
I wanted to lean into the philosophy behind the name, “Year in a Nutshell” and provide in-depth data and insight about a person’s life.
From the start, I knew Yian would revolve around two main pillars: the Calendar section and the Stats section. The design of the app would then be centered around these two (with an additional 3 more sections) to create the core layout of the app.

Choosing the Tech
When it came time to pick the tech stack, I went with React Native and Expo. At the time, I barely knew either, but here were the two big reasons that pushed me over the edge:
One codebase for both iOS and Android. Normally you would have to write two separate apps — Swift for iOS and Kotlin/Java for Android. React Native lets you write everything in JavaScript and share it across both.
Hot-reloading and real-time testing. Using Expo Go, you can instantly see any changes made on your actual phone — no complicated builds, no waiting. It made development way faster.
Honestly, without Expo, I don’t think Yian would’ve made it off the ground as fast as it did. If anyone’s thinking about building their first app, I can’t recommend React Native + Expo enough!
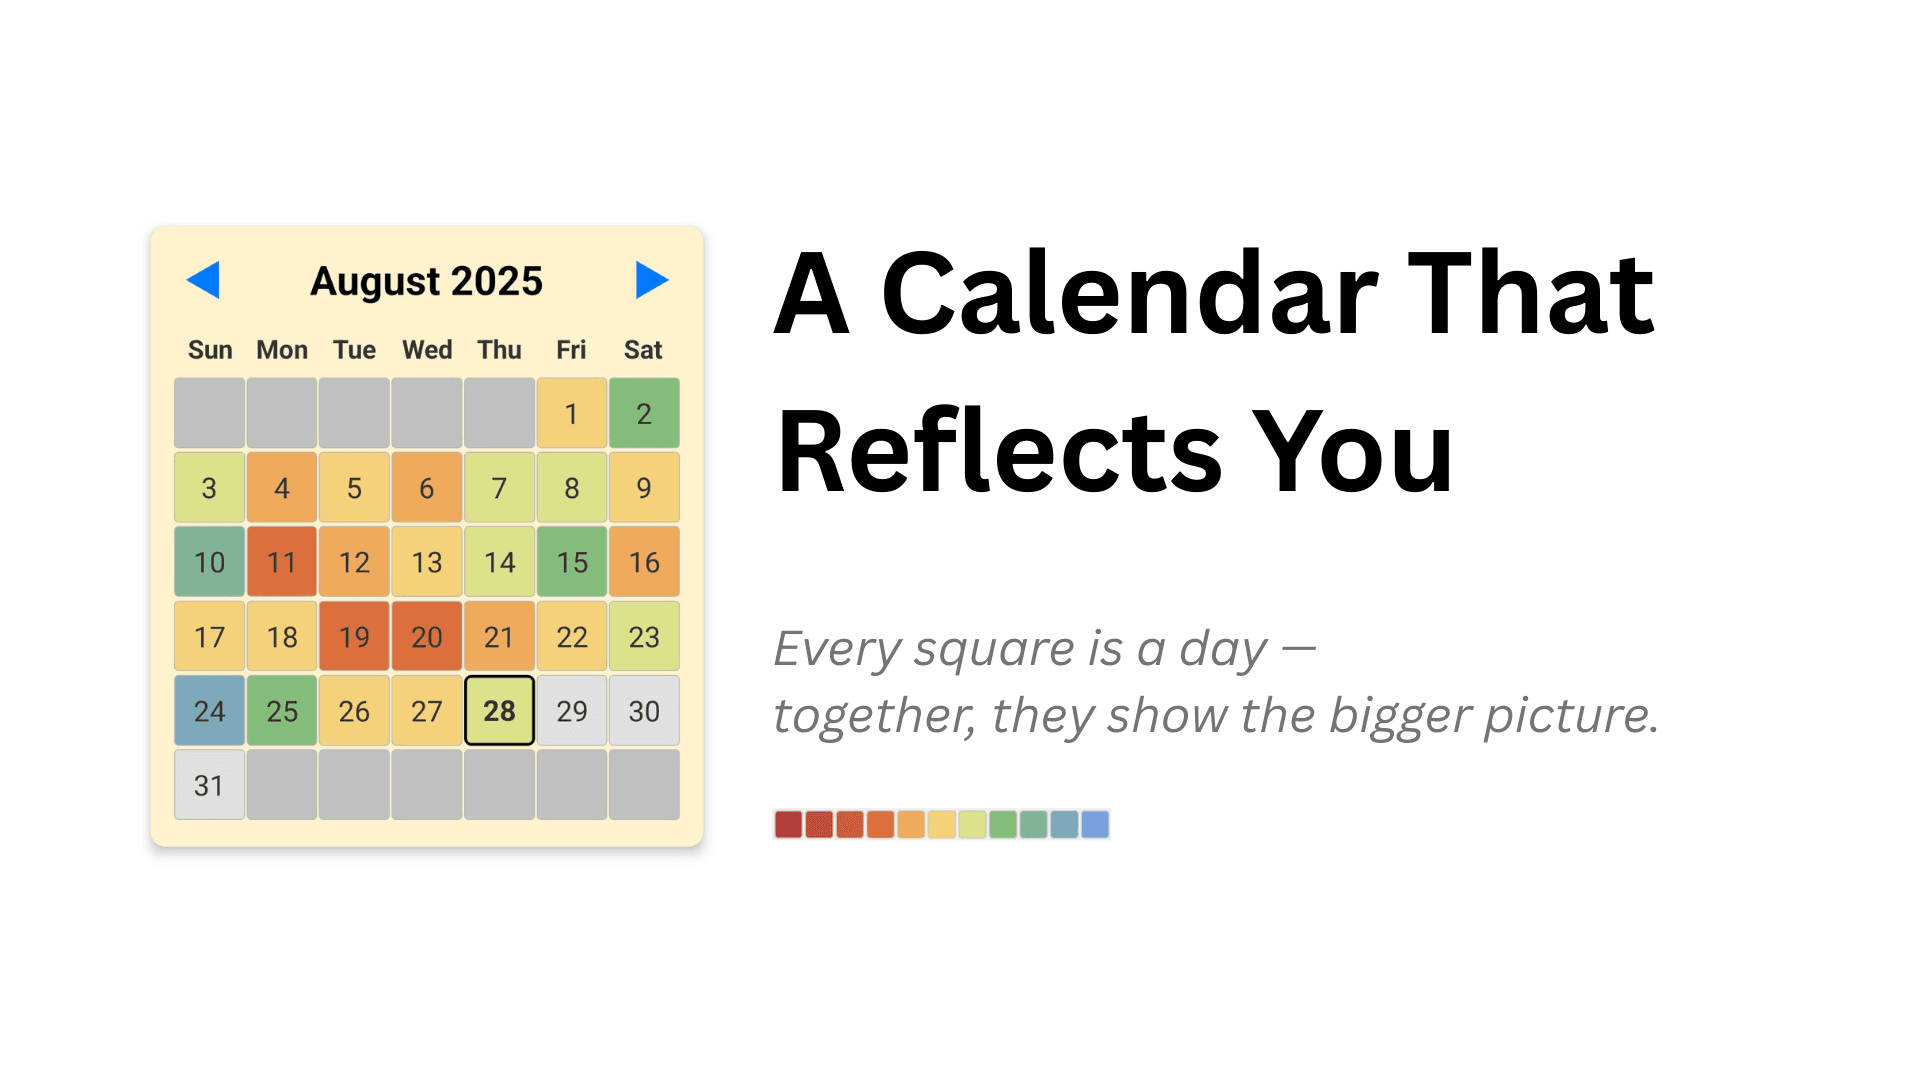
A Calendar App
While the “Year in Pixels” calendar was the inspiration for my app, I expanded the idea to include monthly and weekly calendars too. The Yearly view (the classic “Year in Pixels” layout) is great for seeing your whole year at a glance — but it’s also a little too zoomed out. You can spot big patterns, but not the small stories in-between. That’s why I added the other two views, each giving a different level of detail:
Weekly → Monthly → Yearly.
Partway through designing the calendar, I also added an Event Calendar, which is a staple in most calendar apps. I’d figured that having stats centered around specific dates (think anniversaries, appointments, trips, etc.) would be a valuable addition. For example, think to yourself:
How did I feel overall throughout my trip to Europe?
Out of the countries I visited, which had the highest average rating?
Did birthdays or anniversaries tend to be happier days than normal ones?
What about that stressful job interview — how did I rate that day afterward?

These are some example questions that highlight the value of adding events to my calendar portion of Yian. It takes what’s a common feature in many calendar apps and turns it into a way to connect your schedule with your state of mind.
Over time, this shifted the focus of Yian’s calendar toward something more productivity-oriented (Still a work in progress!). Most productivity apps help you track what you need to do; I aim to make Yian an app that also helps you see how those things made you feel.
A Stats App
This brings us to Yian’s other core feature — the Stats tab.
Functionally, Yian acts like a diary. You rate your day from 0-10 (with 0 being the worst day of your life, to 10 being the very best). Then you go through your daily checklist (or dailies, as I call them — more on them later!), add a few tags, jot down some notes, and even record your location.

What makes Yian different from a typical diary app is what happens after you save your entry. Yian automatically gathers all that data and turns it into meaningful insights — visualizing your life through charts, graphs, and trends. In fact, many of the graphs take direct inspiration from the ones I did in my “Year in Pixels” Calendar:

One of my favorite examples is the Location graph. It shows all the places you’ve been throughout the year, along with how your mood tends to change by location. Here’s an example from a friend of mine — he traveled a lot more than I did this year!

I also want to briefly go over the Dailies and the Tags (I plan on making dedicated articles in the future so I will keep it short here- also this article is getting really long!)
Dailies — short for daily tasks — are habits or routines you want to track. You create them yourself, and each night you check off which ones you completed. Yian keeps track of your success rate over time and shows you how consistent you’ve been.

Tags, on the other hand, are totally freeform. They can be anything you want to keep an eye on. It is up to the user’s choice (and creativity!) to put whatever they feel like tracking over the course of the year. Some basic examples may include:
How many times did I eat McDonald’s this year?
How many times did I feel sick this year?
How often do I go to get a haircut?
Whatever you may want to keep track of, just tag those days, and Yian will show you how frequently they happen, broken down by day of the week or month. Also it is possible to have more than 1 instance of a tag in a day (say for example you eat McDonald’s 3 times in one day). Over time, these little details start forming patterns about your life that you’d never notice otherwise.

I plan to add more stuff to Yian in the future, but for now these are the core features that are centered around the Stats portion of my app. Suggestions are always welcome!
Closing Notes
I started working on Yian from January of this year, and it took until early September to officially get it published to the App Store. The Google Play version followed suit and was published late into September as well. Although it seems like it took a long time to get here (basically 9 months, so its like my child..?), the app is still very new and has a lot of room for growth/improvement. Even then, I still believe I have a strong foundation for an app. Yian sits at the intersection of a diary, a calendar, and a stats app — combining the personal reflection of journaling with the structure of productivity tools and the insights of data visualization.
What started as a simple “Year in Pixels” spreadsheet has turned into a tool that helps people see their lives in a new way. If you love data, graphs, or just the idea of turning everyday life into something visual, I encourage you to give Yian a try. You might be surprised at what you learn about yourself — not from what you remember, but from what you record.
My goal is to keep improving Yian and eventually make it the go-to space for anyone who wants to understand themselves better through data. If you have any suggestions or ideas, do not hesitate to reach out!
Thank you sincerely for reading until the end :)
- Jungwoo Kwak
🔗 Learn more or download the app at yian.app